



 BBC News
Borrowing was £17.4bn last month, the second highest October figure since monthly records began in 1993.
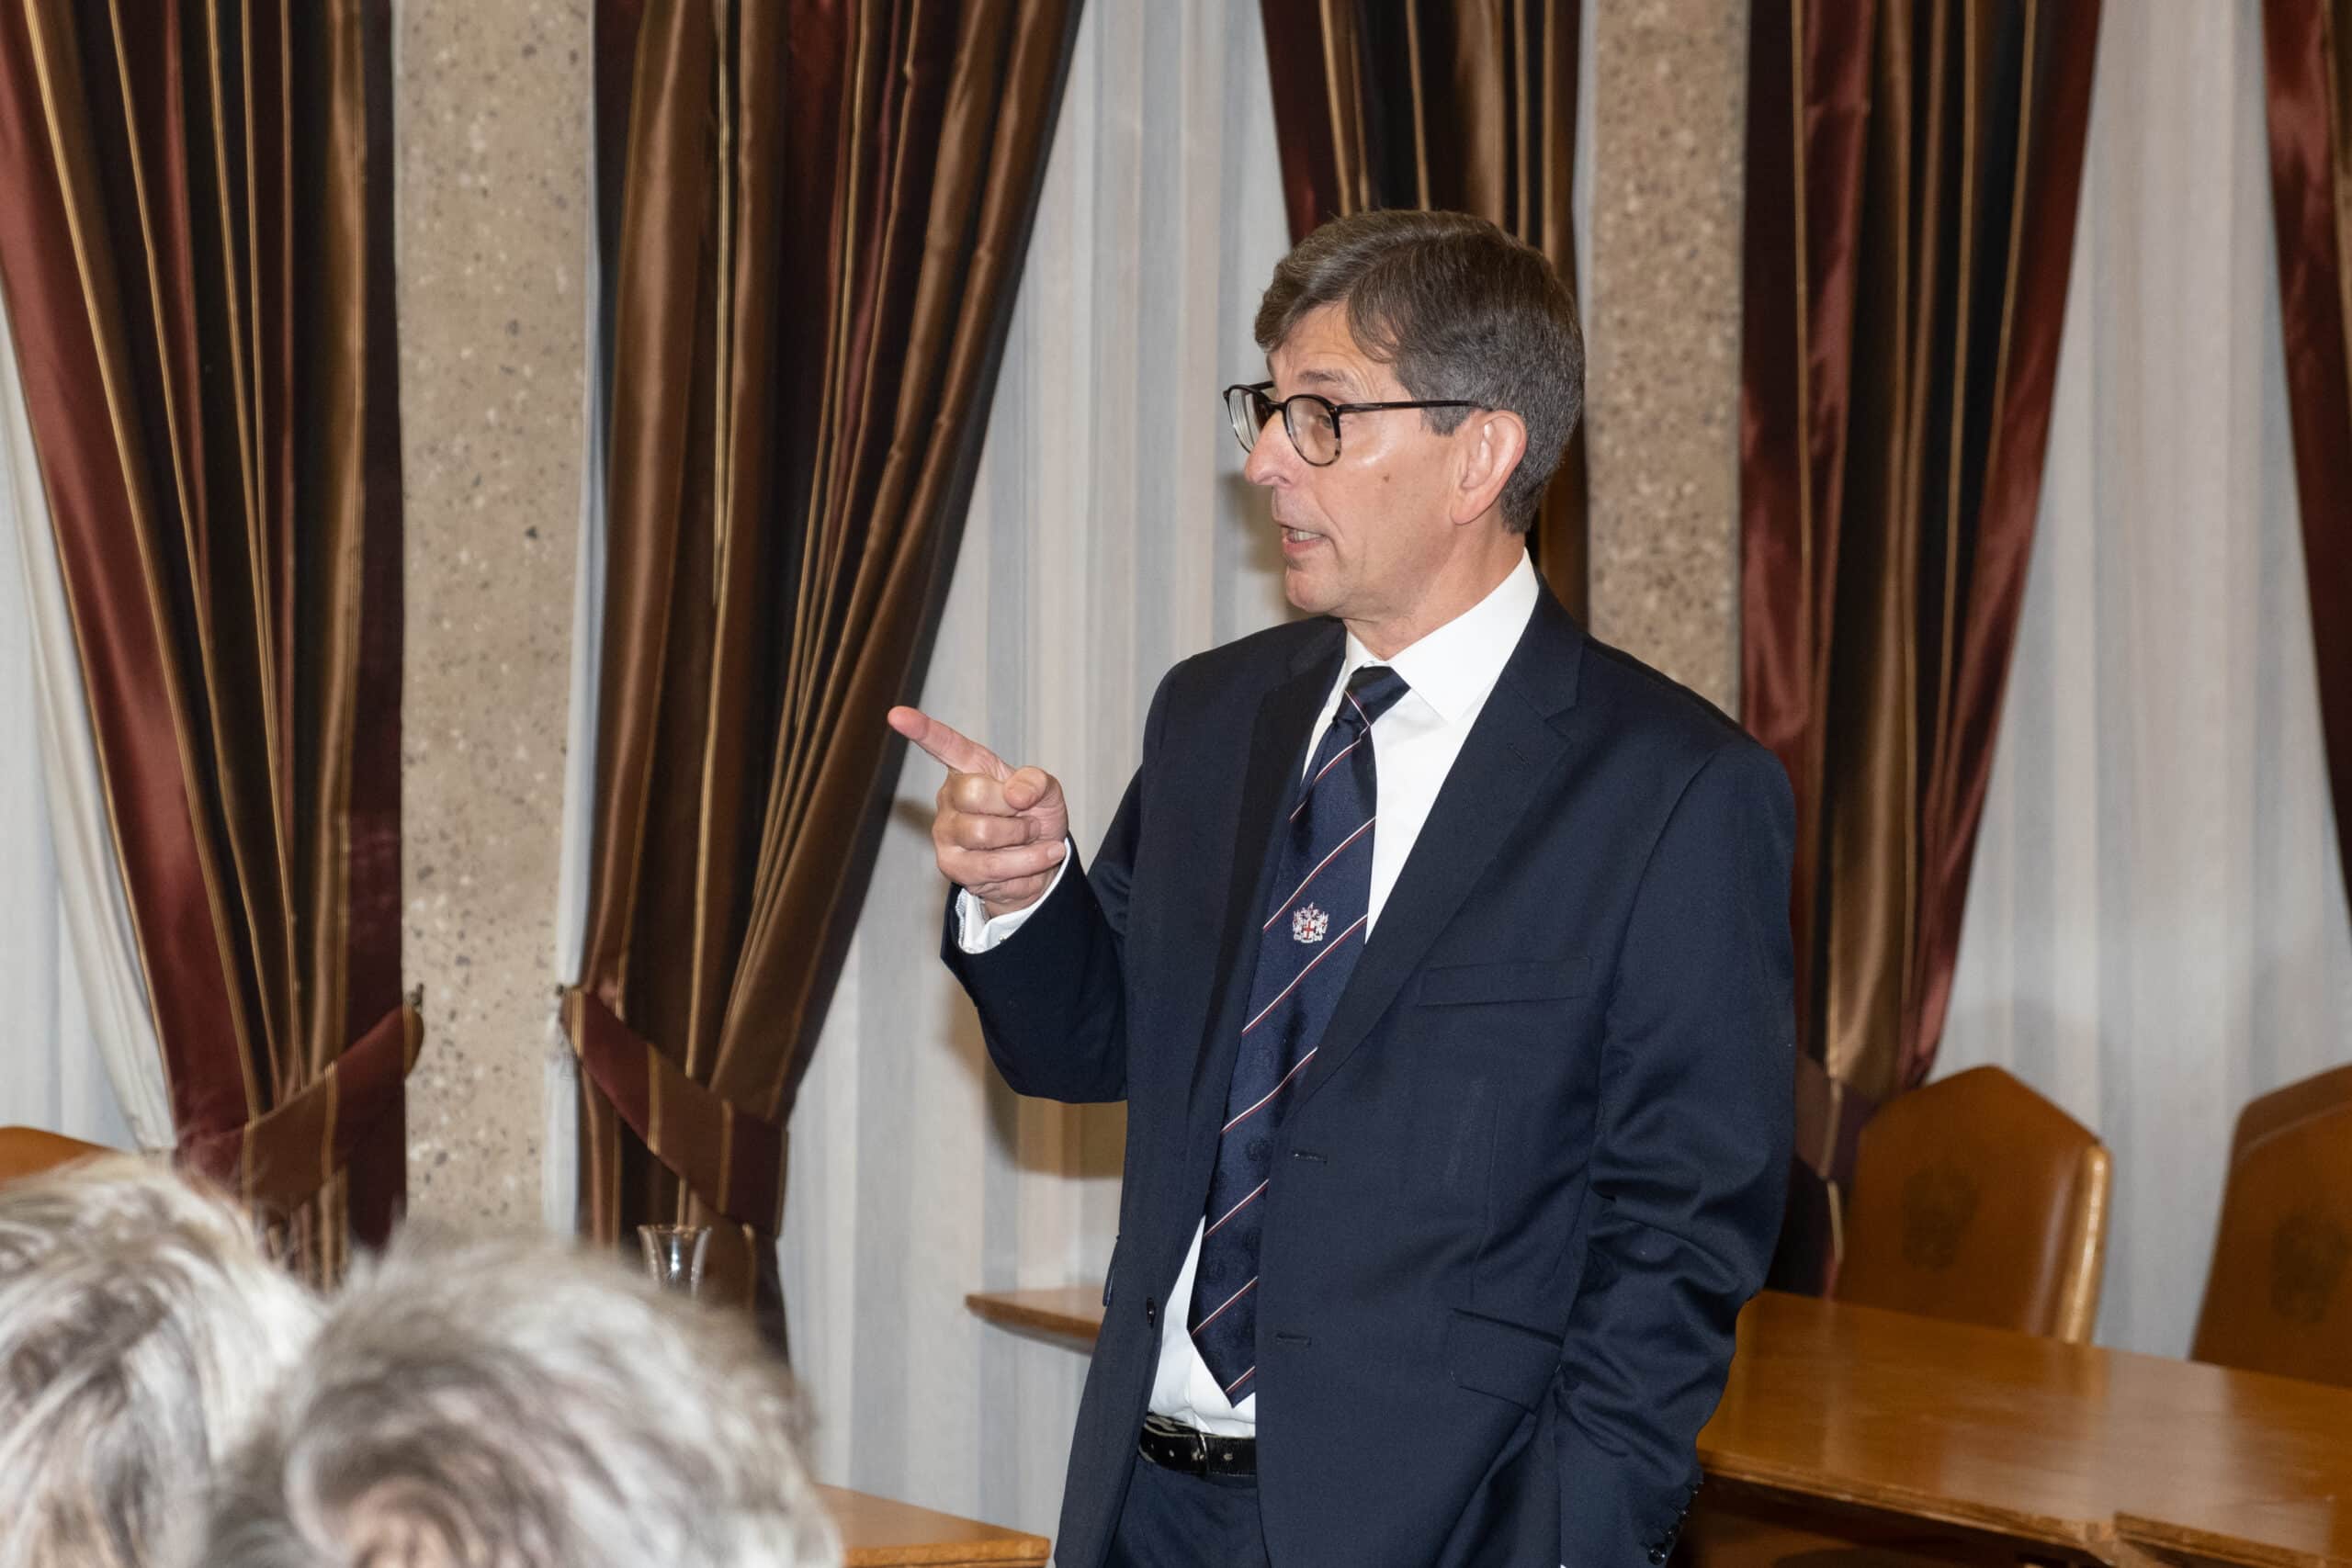
Education expert Tim Clark on PISA, and how it reminds us of the need to address the teacher retention crisis
What is PISA?
The Programme for International Student Assessment (PISA) assesses knowledge and skills in science, reading and mathematics amongst 15-year-old pupils in countries around the world. PISA is run by the Organisation for Economic Co-operation and Development (OECD), and the assessment is typically carried out every three years. PISA 2022 was undertaken four years after the previous assessment in 2018 because of the pandemic. PISA 2025 restores the 3-year cycle and involved 91 countries, including England and the other nations of the United Kingdom [education is a devolved matter]. In England, 5,619 15-year-old pupils from 183 schools completed a 2-hour computer-based assessment and a pupil questionnaire that took approximately 30 minutes to complete.
Analysis of the 2025 assessments was undertaken for the Department for Education by the University of Oxford and UCL Institute of Education and was published in September 2026. All quotations in this commentary are taken from that analysis.
How did England perform?
In 2025, pupils in England, as in previous years, “significantly” outperformed their counterparts in Northern Ireland, Scotland and Wales.
Science – England was ranked eighth internationally. The score for pupils in England in 2025 (516) was significantly above the score of 503 in PISA 2022 but not significantly different from average scores in 2018 (507) and 2015 (512).
Reading – England was ranked fourth. Pupils achieved an average reading score of 497 in 2025, significantly above the OECD average of 461. The average score for pupils in England in reading in 2025 was not significantly different from average scores in previous cycles.
Very encouraging news is that the gender gap in reading has declined. The gender gap in England (11 points) was significantly narrower than the OECD average gap (30 points).
Mathematics – England was ranked tenth. Pupils in England achieved an average mathematics score of 492 in PISA 2025, which was significantly above the OECD average of 46. In 2025, the average mathematics score achieved by pupils in England was significantly below the average mathematics score achieved in PISA 2018 (504) but was not significantly different from the average scores that pupils achieved in 2022 (492) and 2015 (493).
The need for caution
P8/9 “When reading this report, it is important to keep in mind that England’s sample of participating pupils may not be entirely representative of all 15-year-old pupils in England.” Although the set of participating schools was highly representative of the national distribution of schools, there is, however, some evidence that within those schools, those who did not take part [“non-responding pupils”] were “slightly more likely to speak English as a first language, slightly more likely to have been eligible for free school meals at some point in the last 6 years of their education and slightly more likely to receive a form of special educational needs support”. “Both for England and for other participating countries, this means that results should be interpreted cautiously, particularly when considering trends in performance over time and when making international comparisons. More confident conclusions can be drawn when making comparisons between groups of pupils within England.”
The questions for the tests are submitted by each individual country and the organisers then try to attain a consistent level of difficulty. Since each participating country has a different education system and curriculum (there is no attempt, for example, to coordinate curriculum, teaching styles or philosophy of education between England, Ecuador, El Salvador and Estonia) cross country comparisons require caution. “Cross country comparisons presented in this report should still be cautiously interpreted, especially when comparing countries with different languages.” Even more worryingly, “were the test to be retaken, there would likely be differences in the average scores of each country that would cause the rank order of performances to change”.
The not so good news
· We must be cautious not to solely focus on international ranking both for the reasons given above but also because there is not necessarily a correlation between ranking and actual performance. In science, for example, between 2009 and 2022, England’s performance declined but the ranking improved. Consider England’s actual performance in 2006: reading = 496 [497 in 2025]; mathematics = 495 [492 in 2025] and science = 516 [516 in 2025]. Have there actually been significant improvements in performance or has England’s ranking improved simply because other countries are performing less well?
· Pupils in England who were eligible for free school meals (FSM) achieved average scores in science, reading and mathematics significantly below scores for pupils who were not eligible for FSM.
· The average reading and mathematics scores for pupils in England with a second generation immigration background were significantly above (and in science, above) the average scores for both first-generation immigrant pupils and non-immigrant pupils. (P141-143) This means that white working-class pupils continue to be amongst the lowest performing.
· In science, the range between England’s highest− and lowest−performing pupils was 274 points. This was significantly larger than the OECD average of 258 score points but was not significantly different from the ranges in PISA 2022, 2018 and 2015.
· In England there was a significant gap (–13 score points) between the performance of girls and boys in science in 2025 (509 compared with 522). By contrast, there was no significant difference between girls’ and boys’ science scores in England in 2022, 2018 or 2015.
The following points are taken from Oecd.org which does not differentiate between the four devolved authorities of the United Kingdom, although I am not aware of evidence to suggest that Heads/Principals in England would differ strongly from the UK-wide evidence.
· In 2025, 48% of students in the United Kingdom were in schools whose principals reported that instruction was hindered, at least to some extent, by a perceived lack of teaching staff (OECD average: 39%); the corresponding share for a perceived lack of assisting staff was 39% (OECD average: 39%).
· Principals’ concerns about inadequate or poorly qualified teaching staff increased from 19% in 2022 to 31% in 2025 (OECD average: 25% in both years).
· Some 24% of students in the United Kingdom attended schools whose principals reported that a lack of educational material (e.g. textbooks, IT equipment, library or laboratory material) hindered instruction, at least to some extent, and 34% were in schools where a lack of physical infrastructure (e.g. buildings, grounds, heating/cooling systems, lighting and acoustic systems) was perceived to hinder instruction. In 2022, the corresponding shares were 13% and 24%, respectively.
· In the United Kingdom, 23% of students reported being victims of at least one form of bullying a few times per month or more in 2025 (OECD average: 20%).
· Disciplinary climate in science lessons in 2025 remains a concern in many countries and economies: about 17% of students in the United Kingdom reported that they cannot work well in most or all lessons (OECD average: 19%); 38% reported noise and disorder disrupted most or every science lesson (OECD average: 31%); 31% of students reported that their classmates do not listen to what the teacher says (OECD average: 29%).
CONCLUSION
The three-year cycles of PISA assessments provide educationalists and policy makers with valuable evidence to be used appropriately. Caution must be exercised over the data, both concerning its reliability within each country but especially when trying to rank countries against each other.
If we adhere to the analysis undertaken by the University of Oxford and UCL Institute of Education, then the evidence is most reliable when used internally and it is there, that some of the most worrying trends appear.
England’s teachers and Heads can be proud of the work they do, very often trying to overcome ever increasing demands – larger class sizes, poor discipline, persistent absence, a lack of facilities and resources and, most significant of all, a lack of qualified teaching staff. Yet again, the evidence is clear: the single biggest barrier to school improvement is the teacher recruitment and retention crisis. We can only keep saying it, but only when there is an adequate supply of highly trained, highly motivated and highly effective classroom teachers, will our school system really deliver.